The Dashboard
The Dashboard gives you a visual overview of your inventory and provides statistics such as WLED controller status, unique part count, total stock count, and total inventory value.
You can leave your dashboard as is with the default view, or organize your dashboard using Walls.
Default View
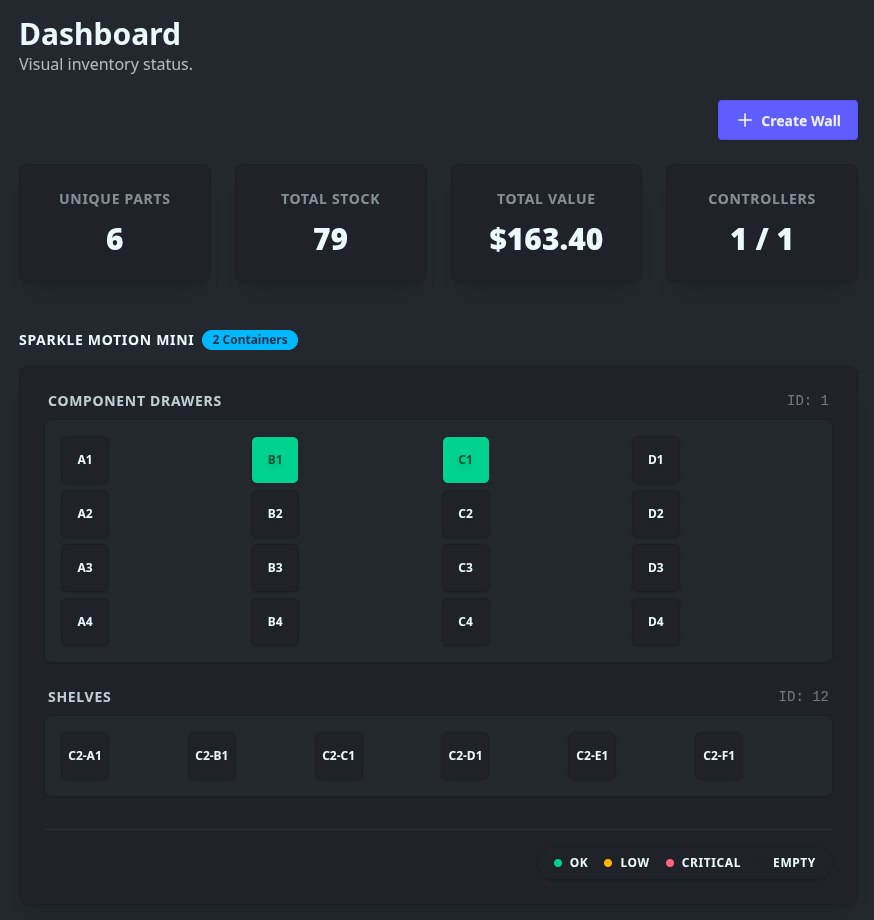
By default, the dashboard is organized by WLED controller. Each controller will show a visual representation of each container that belongs to it. Each container will show all of the bins associated with that container. Each bin will show the stock status of the inventory it contains (if any).
Visual Heirarchy
Dashboard/
├── WLED Controller 01
│   ├── Container A (Drawers)
│   │   ├── Bin 1
│   │   ├── Bin 2
│   │   └── Bin 3
│   └── Container B (Box)
│       ├── Bin 1
│       └── Bin 2
└── WLED Controller B (Shelves)
    └── Container C
        └── Bin 1
Walls
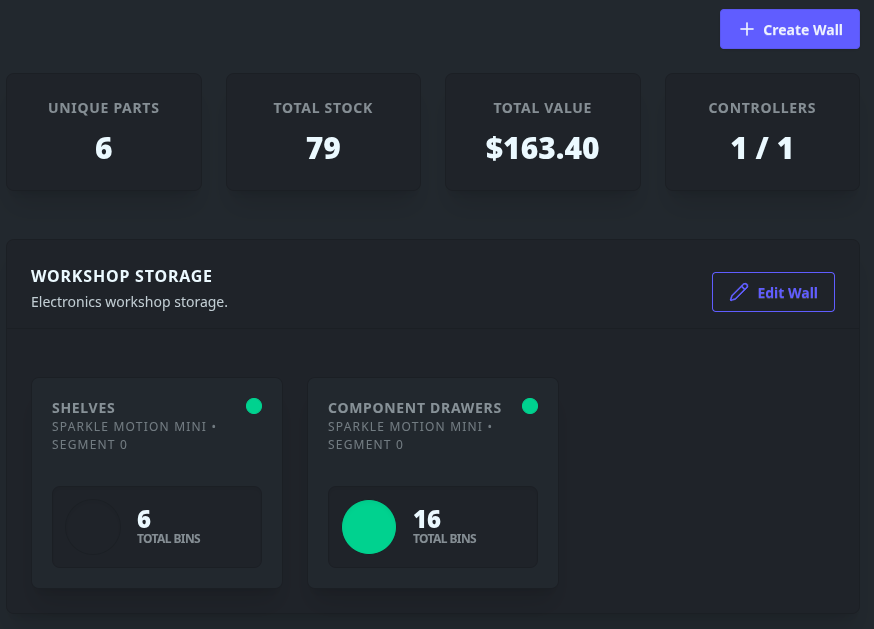
Walls are logic groupings of containers. You may consider using Walls if you:
- have many controllers / containers
- want a more compact dashboard view
You can add any container to any wall, regardless of which WLED controller it belongs to.
Creating a Wall
Status Indicators
Bins and Wall cards change color on the based on stock levels:
- 🟢 Green: OK
- 🟡 Yellow: Low Stock
- 🔴 Red: Critical/Out of Stock
- ⚫ Black Empty / No Inventory Assigned
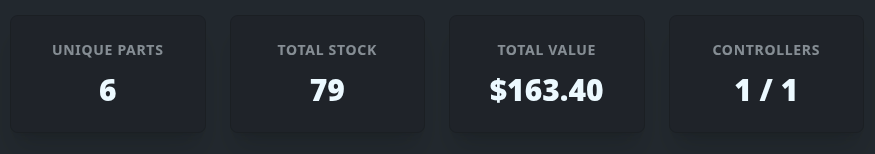
Inventory Stats
View total unique parts, total stock value (if configured), and the real-time connectivity status of your WLED controllers.